Portfolio overview

Get a complete overview of all main meters across your property portfolio. With intuitive KPIs and metrics, you can easily track consumption trends, identify unusual usage patterns, and compare day vs. night or weekday vs. weekend performance. Highlight key properties, sort by out-of-hours consumption, and explore links between building characteristics and usage.

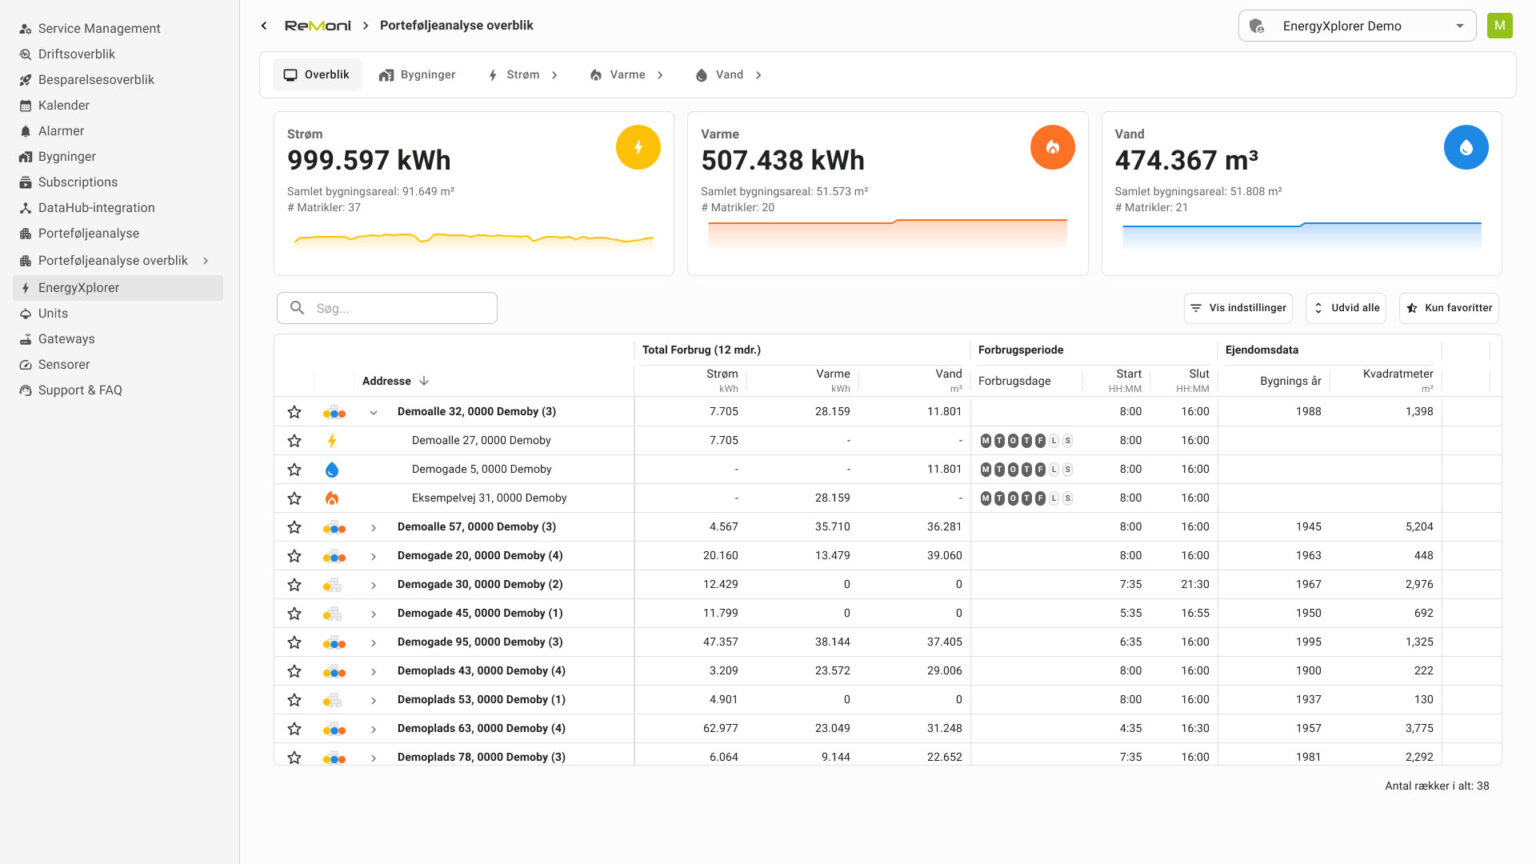
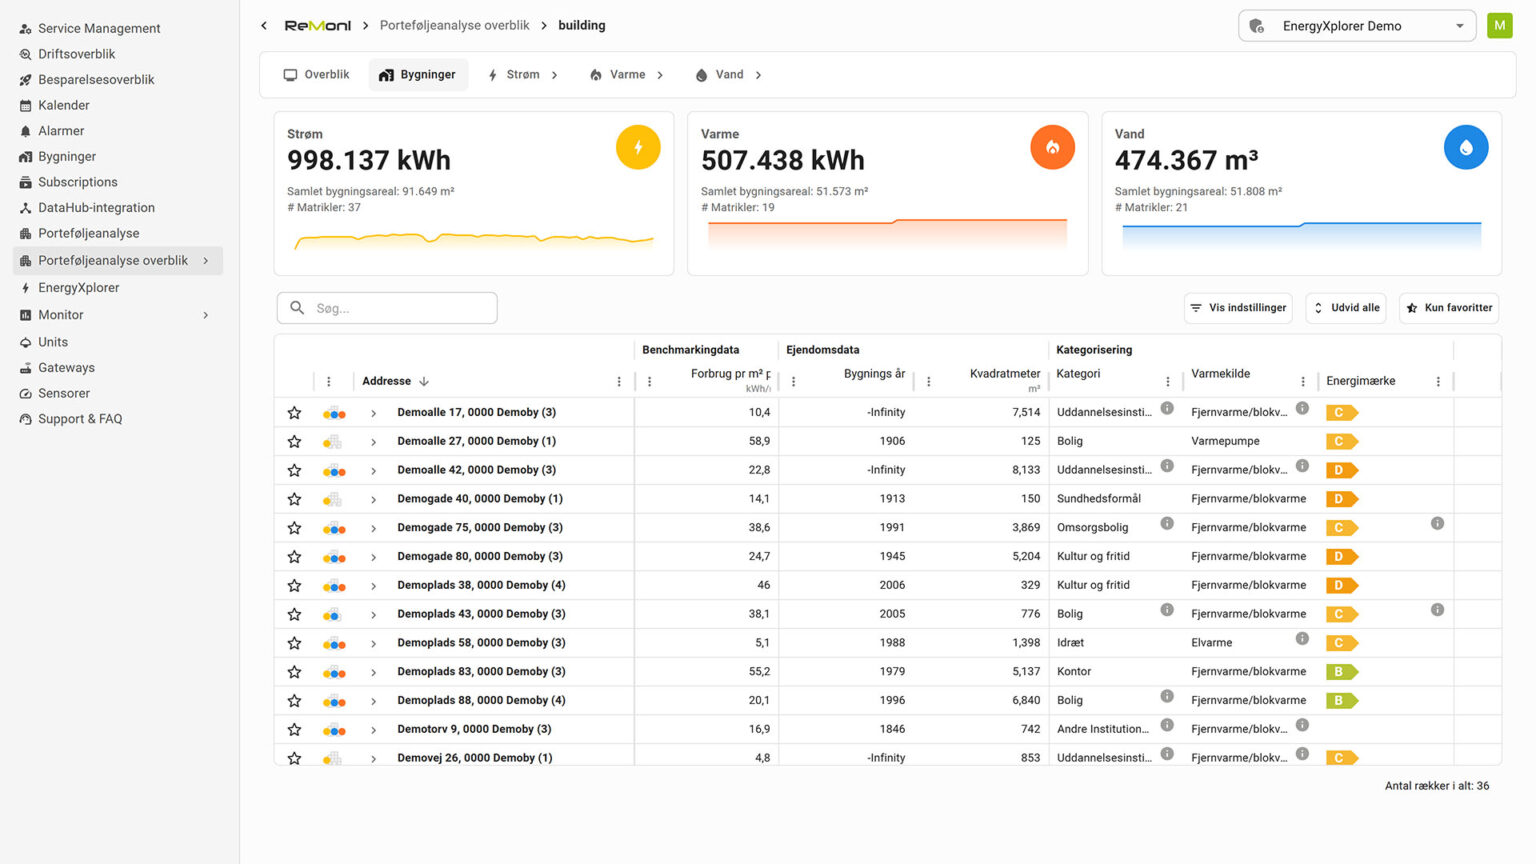
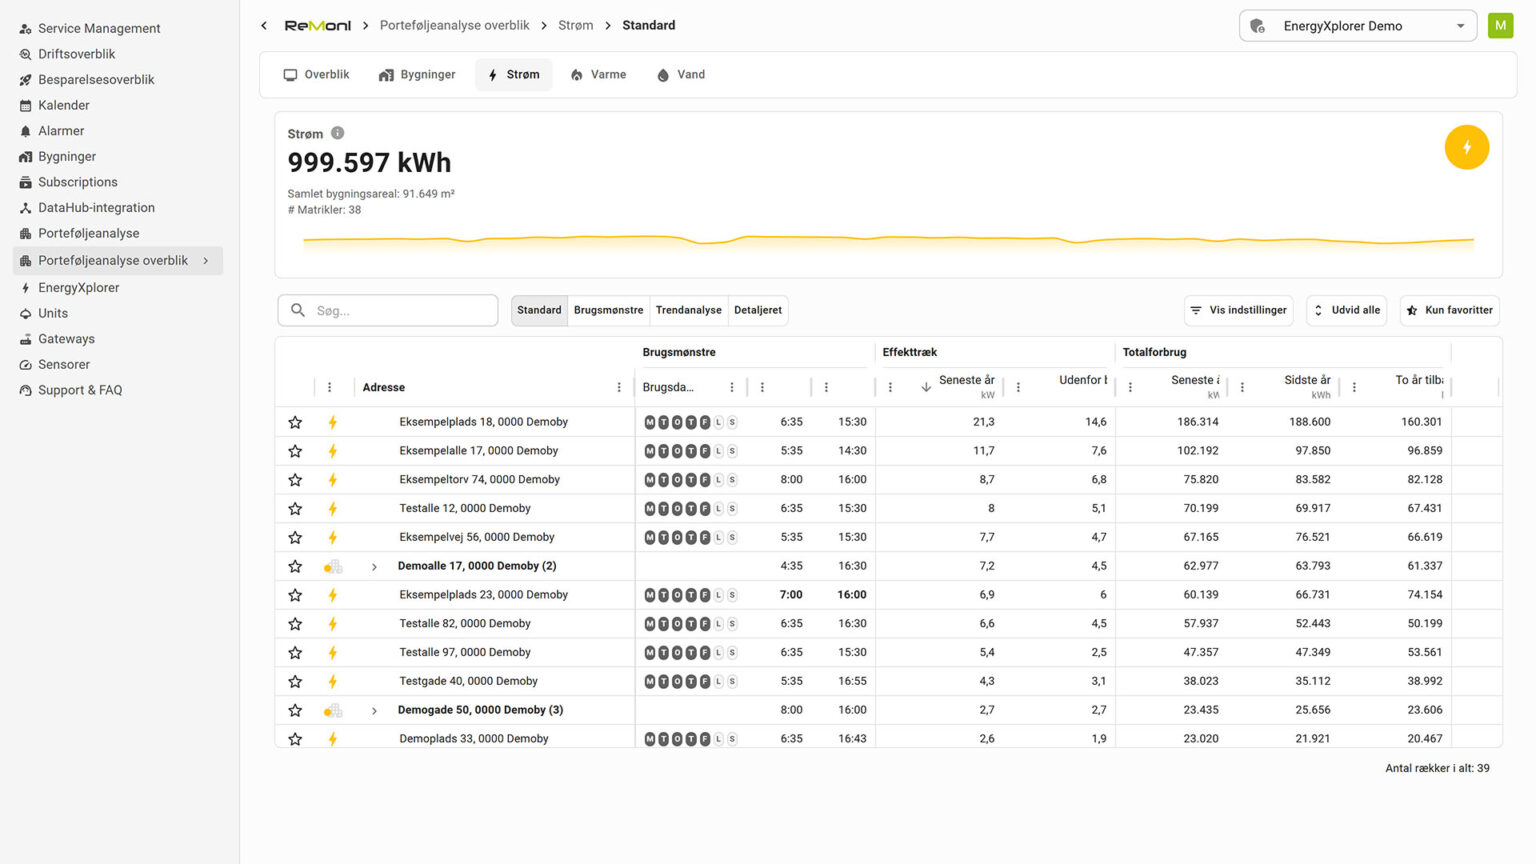
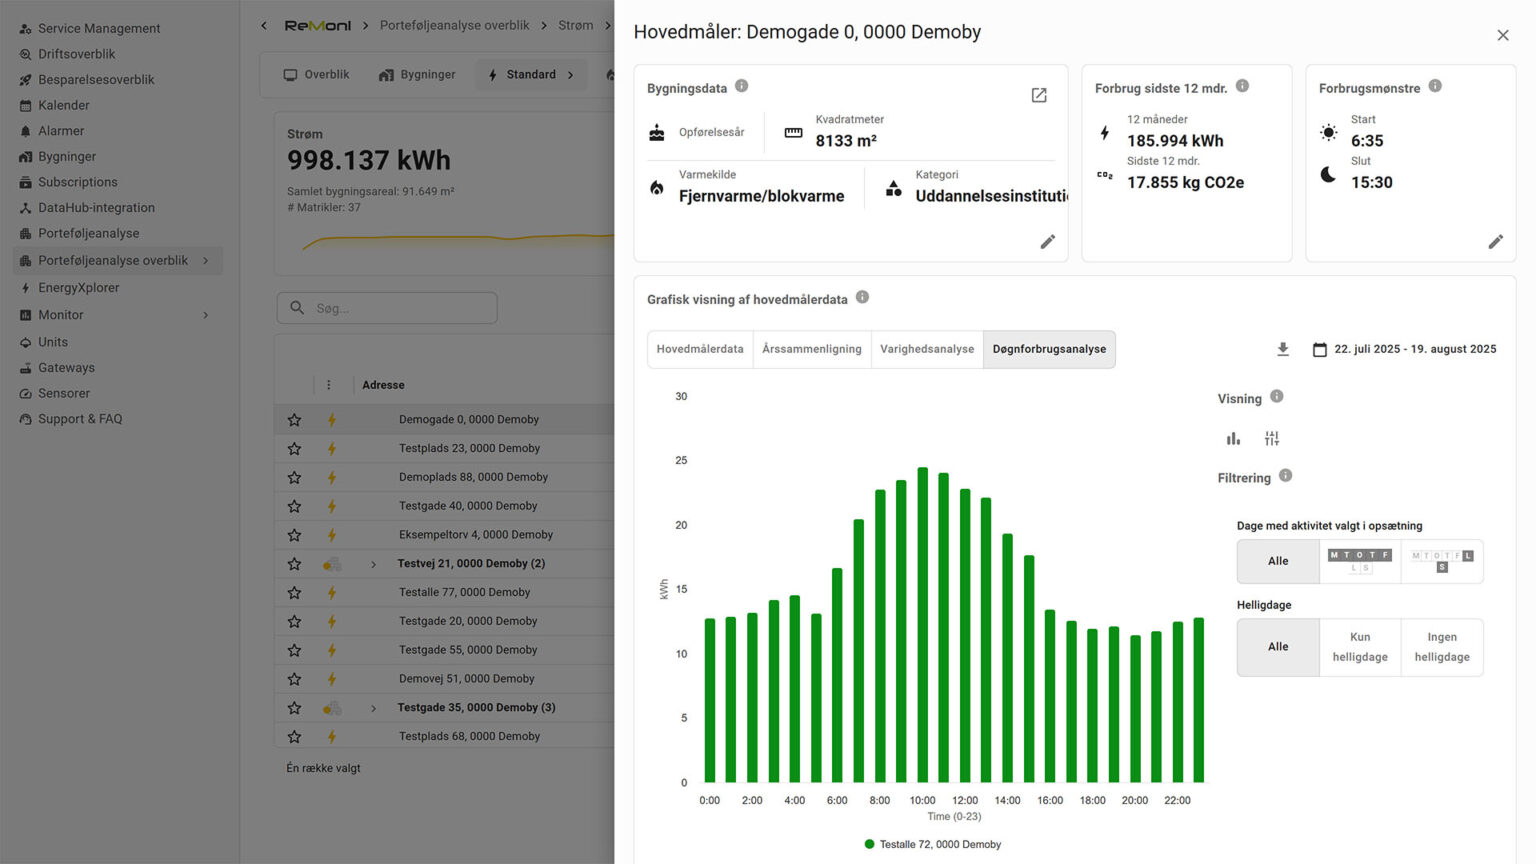
See the big picture. Instantly

Get a crystal-clear overview of energy consumption across your entire property portfolio. Spot trends, highlight inefficiencies, and understand how usage changes over time—so you can take action where it matters most.

Turn data into decisions

Go beyond raw numbers. With intuitive visuals and smart filters, you can zoom in on high-consumption hours, compare weekdays to weekends, and detect unusual patterns at a glance. Make faster, smarter, and more impactful decisions with confidence.

Optimize all consumption

Combine real consumption data with building details like size, energy label, and heating source. Reveal hidden inefficiencies, benchmark performance, and uncover cost-saving opportunities—ensuring every unit of energy is used efficiently.

Overview

The Portfolio Overview gives you a clear and comprehensive insight into the energy consumption across all main meters in your property portfolio. With intuitive key figures and visual metrics, you can quickly assess how consumption patterns have changed over time, how usage is distributed throughout the day, and identify inefficient or unusual consumption behaviors. Easily highlight specific properties you want to monitor more closely, and sort data based on criteria such as high usage outside operating hours, peak consumption between 5–9 PM, or weekend vs. weekday patterns.

By combining consumption data with automatically collected building information—such as floor area, energy label, heating source, and usage type—you gain valuable context for understanding and comparing energy performance. With just one click, you can view average daily consumption, spot irregularities, and export detailed data for further analysis. This makes it easier than ever to identify opportunities for optimization and ensure that all energy use is both necessary and efficient.

Service includes:

Portfolio Overview Dashboard

From Every Main Meter to One View — We ensure the Data

Collecting reliable data from all main meters is the foundation of Portfolio Analysis—and we know how to make it happen. Electricity data is seamlessly sourced from the DataHub, while for water and heat we carefully explore the available integration options with each supplier. Together with you, we map the opportunities, define the smartest path forward, and ensure data flows into the platform.

With our proven experience, existing integrations, and in-house expertise—project managers, cloud developers, data scientists, and even our own sensors and hardware—we deliver a complete package. In some cases, the exact route depends on the technical possibilities offered by heat and water utilities. That means we cannot always define the final solution or cost upfront, but we guarantee that the chosen approach will be the most effective, future-proof, and reliable way to secure all your consumption data.

Concrete reduction initiatives

By using ReMoni’s Predictive Heat Optimization solutions companies can save up to 36% in the energy consumption and decrease in CO2 emissions, making it a perfect solution for companies looking to improve their sustainability efforts or struggling to meet CO2 emission requirements for Scope 2 ESG reporting.

Predictive Heat Optimization uses ReMoni’s IoT sensors to continuously collect data about the building(s) and its usage patterns. Data from the building, actual occupancy of the building, weather forecasts, combined with data on how the weather affects the building, is fed to an Artificial Intelligence model that predicts necessary heating and then controls building’s heating system.

Features

Non-invasive stand-alone installation without changes to your HVAC system.

Heating optimization using AI algorithms predicting necessary heating ensuring the right comfort temperature while maximizing CO2e savings.

Transparent and automated overview and reporting on energy savings and CO2 reduction.

Heating optimization focusing on external and internal factors affecting the building (occupancy, thermal factors, weather conditions etc.)

Concrete reduction of energy consumption and CO2 emission with positive or at minimum a neutral impact on budgets.

The EnergyXplorer solution helps you gain control over building’s resource consumption, as it collects comprehensive energy data beyond main meters, by tracking consumption of different units and appliances. This will provide a better understanding on energy distribution and usage within a building and identify significant energy users (SEU's) leading to measures for energy savings and CO2e reduction.

The solution can help prevent malfunctions and issues leading to energy waste, by continuously tracking using patterns and potentially predicting the problems before they occur, sending automated alarms to warn about the discrepancies.

The solution collects the data needed for ESG reporting and also works as a tool for better energy data management and optimization, positively contributing to company sustainability efforts.

Features

Non-invasive IoT sensors used for continuous energy data collection.

Automated data collection for ESG reporting.

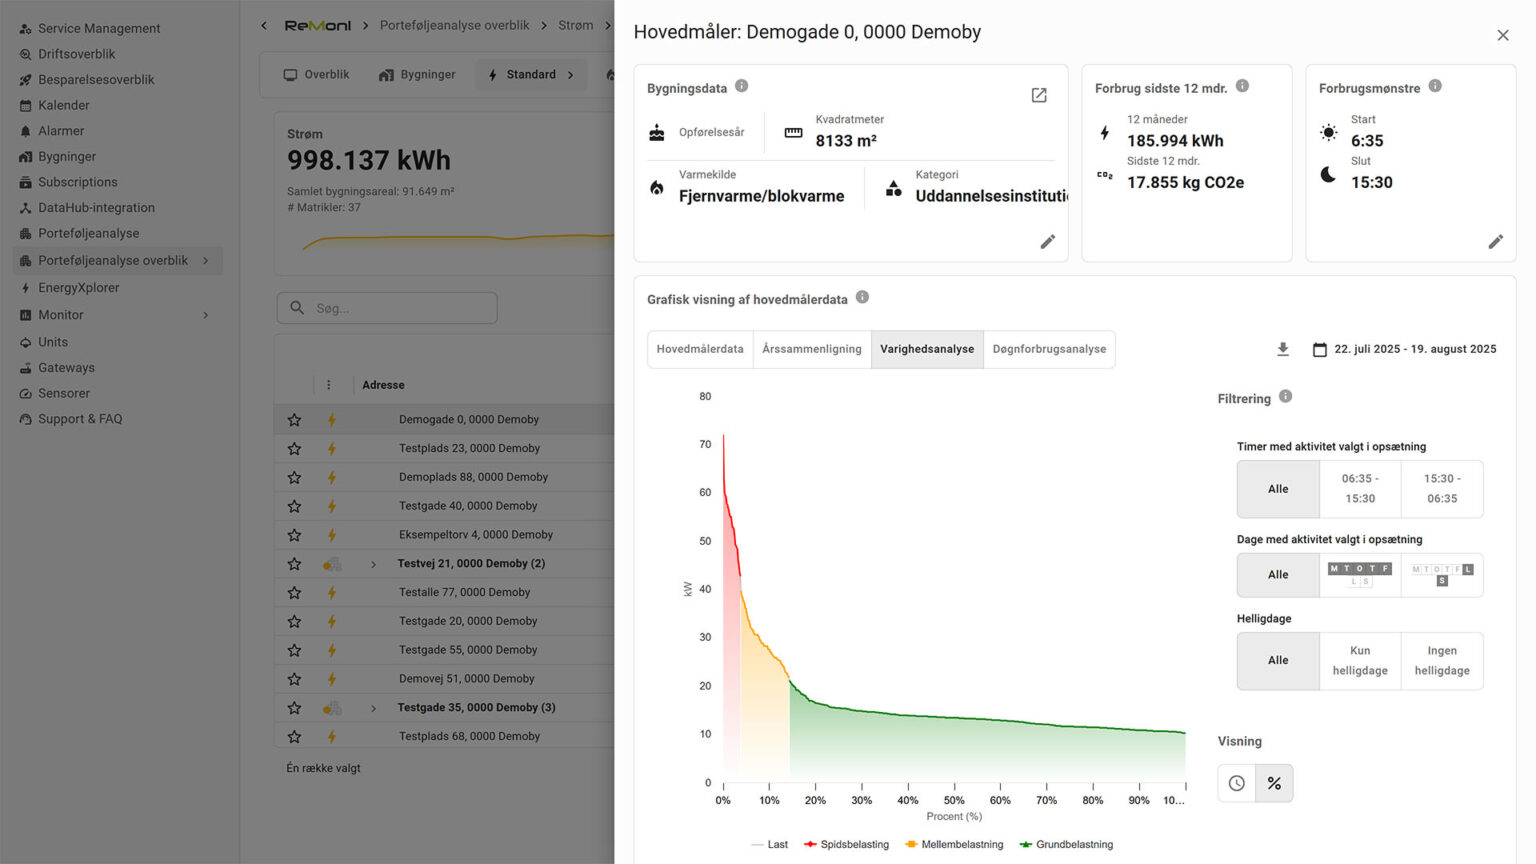
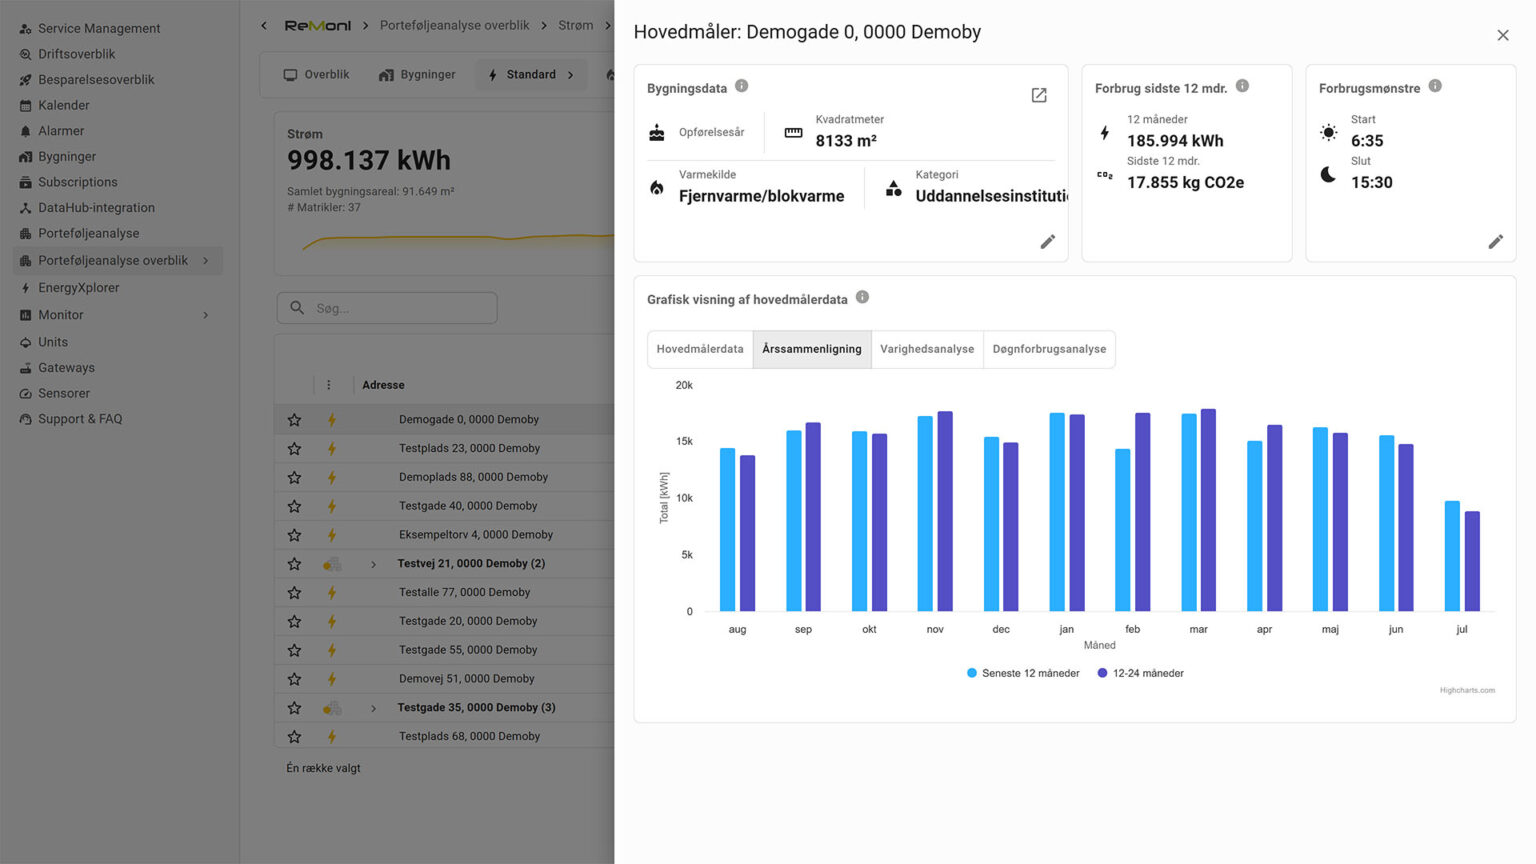
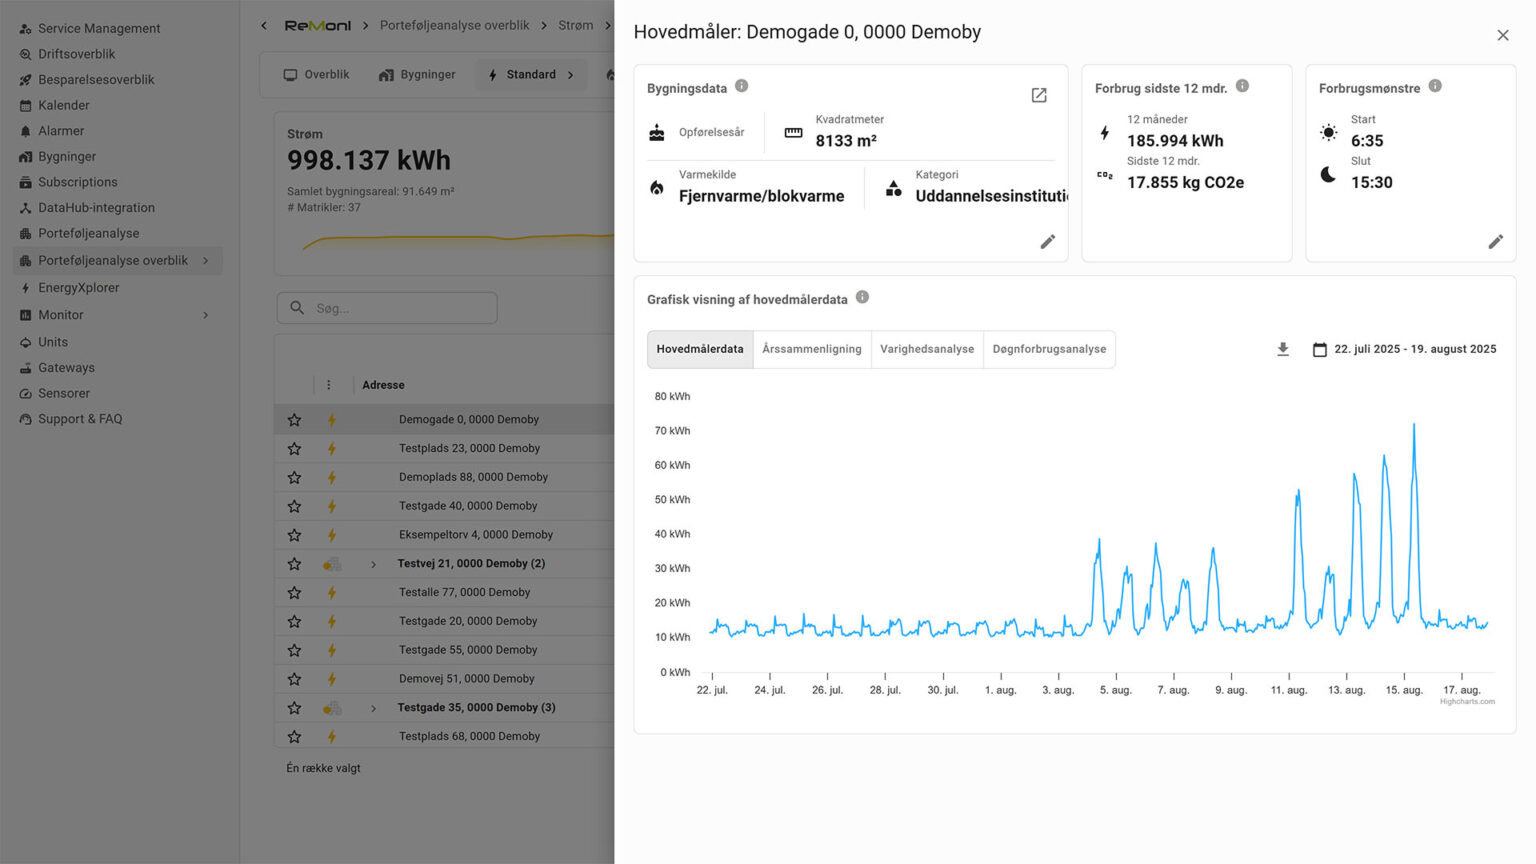
Consumption data visualization available via API or on ReCalc, ReMoni’s cloud platform.

Help to identify SEU's in the building(s), enabling to take action to reduce CO2 emissions and increase energy-savings.

The EnergyXplorer supports ISO 50001 compliance by enabling precise monitoring of significant energy users (SEUs) through non-invasive, real-time data collection. By going beyond main meters, EnergyXplorer tracks energy usage across units and equipment, supporting the standard’s requirements for energy mapping, performance tracking, and continuous improvement.

Through automated data analysis and alerts, the system helps identify irregular consumption patterns, supports operational control, and proactively prevents energy waste. This ensures alignment with ISO 50001’s emphasis on improving energy efficiency and reducing environmental impact.

EnergyXplorer also simplifies ISO documentation and audit readiness with clear, structured performance data.

Features

Real-time SEU monitoring for ISO 50001 energy mapping and tracking.

Non-invasive IoT sensors that simplify installation and minimize disruption

Automated reporting and documentation for audit support.

Integrated visualizations via API or ReCalc, ReMoni’s cloud-based platform.

Early detection of inefficiencies to support continuous improvement and CO₂ reduction.

Customer cases

ReMoni already serves several customers and here is what they think about our products and services.

Our other solutions

Predictive Heat Optimization

Optimize and control heating during non-occupied hours to reduce energy consumption and CO2 emissions in non-residential buildings using AI and ReMoni’s IoT clamp-on sensors.

ESG Compliance

Automated data collection for Scope 2 CO2 reporting with precise, real-time monitoring through ReMoni’s non-invasive IoT sensors as well as different initiatives for CO2 reduction.

EnergyXplorer

A detailed breakdown of resource consumption by units in non-residential buildings, as well as identification of energy-saving measures and problem areas in the building portfolio.

Book a meeting with us