In its shortest version ReCalc is a data presentation
In the extended version it is an IoT-based visual data presentation platform and a part of ReMonis end-to-end solution – regardless the sensor type.
In ReCalc you can access all data sampled by your sensor(s) and adjust the measurement rate and which changes should trigger an alarm. ReMonis sensors report data in real time to help you get aware of your invisible consumption. With ReCalc you have influence on the data sampling rate, which enables you to sample data based on your needs.
Get started with ReCalc
When receiving our solution, you get one or more sensors and a gateway. Clamp on the user-friendly sensor(s) on the outside of the cable or pipe and connect the wireless gateway to a power supply and to the internet.
On the outside of your new gateway there is an ID-number which you will need to log in at ReCalc.
Setting up ReCalc is simple and gives you maximum control of your energy monitoring
First time you access your data you need to create the sensor unit by its ID-number. If you need assistance, you can find an explanation with an indicative screen dump here. When your sensors have been created you can log in and get started.
Tip: Find a shortcut to ReCalc in the top right corner of ReMonis website

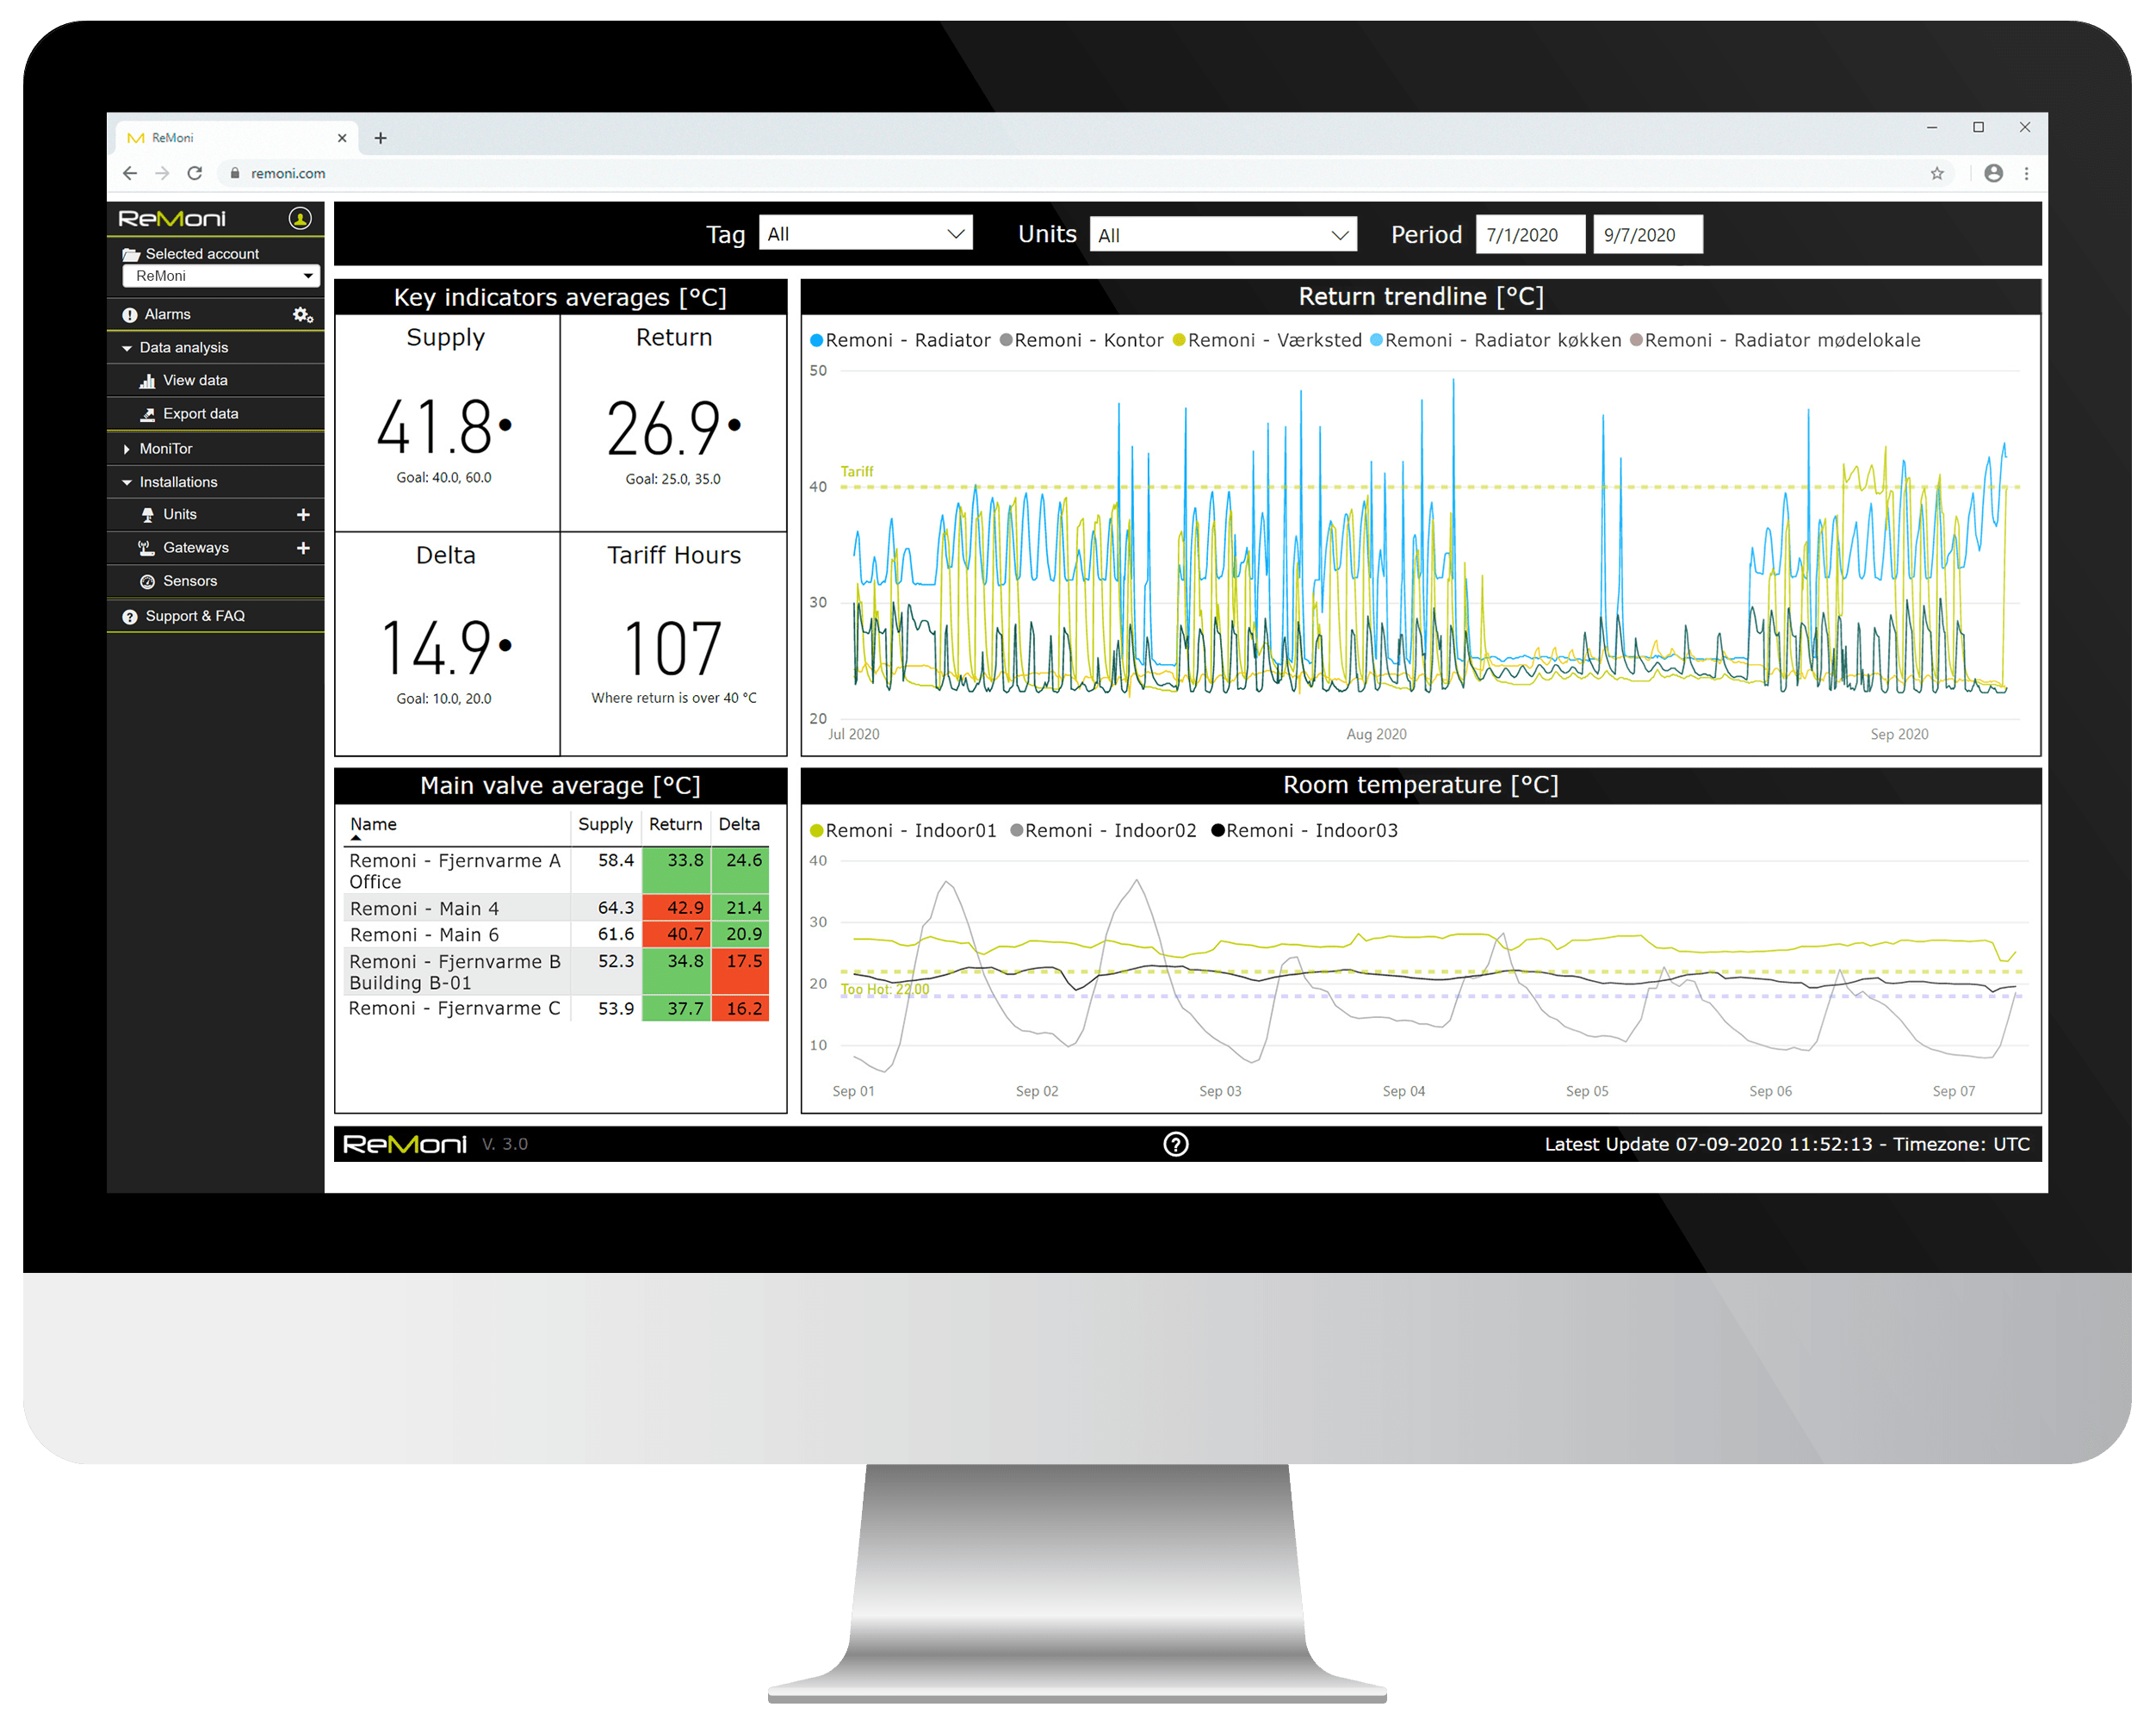
Figure: Data presentation in ReCalc showcasing the consumption for district heating with a HeatMoniSpot.
How to use ReCalc
ReCalc is an online platform for data presentation. To start using it you must create a login to recalc.remoni.com, where you can access data and adjust the frequency of the samplings. This gives you maximum control of your energy monitoring in an area where influence on data sampling is rather unusual. By using ReCalc it becomes easy to react based on the following:
-
Graphical data presentation in ReCalc
-
User settings for alarms and warnings
-
User settings for ReMonis different sensors
-
ReCalc can easily be connected to the extension ReCalc MoniTor
You can use ReCalc on computer, tablet and smartphone
When logged in you can create multiple users and accounts to give different employees access to different data sets. One of ReCalcs strengths is the connection between advanced data sampling and the simple data presentation. Thanks to this, the consumption pattern gets easy to analyze, understand and not at least to act upon.

Figure: Data presentation in ReCalc Monitor showcasing the power consumption in kWh.
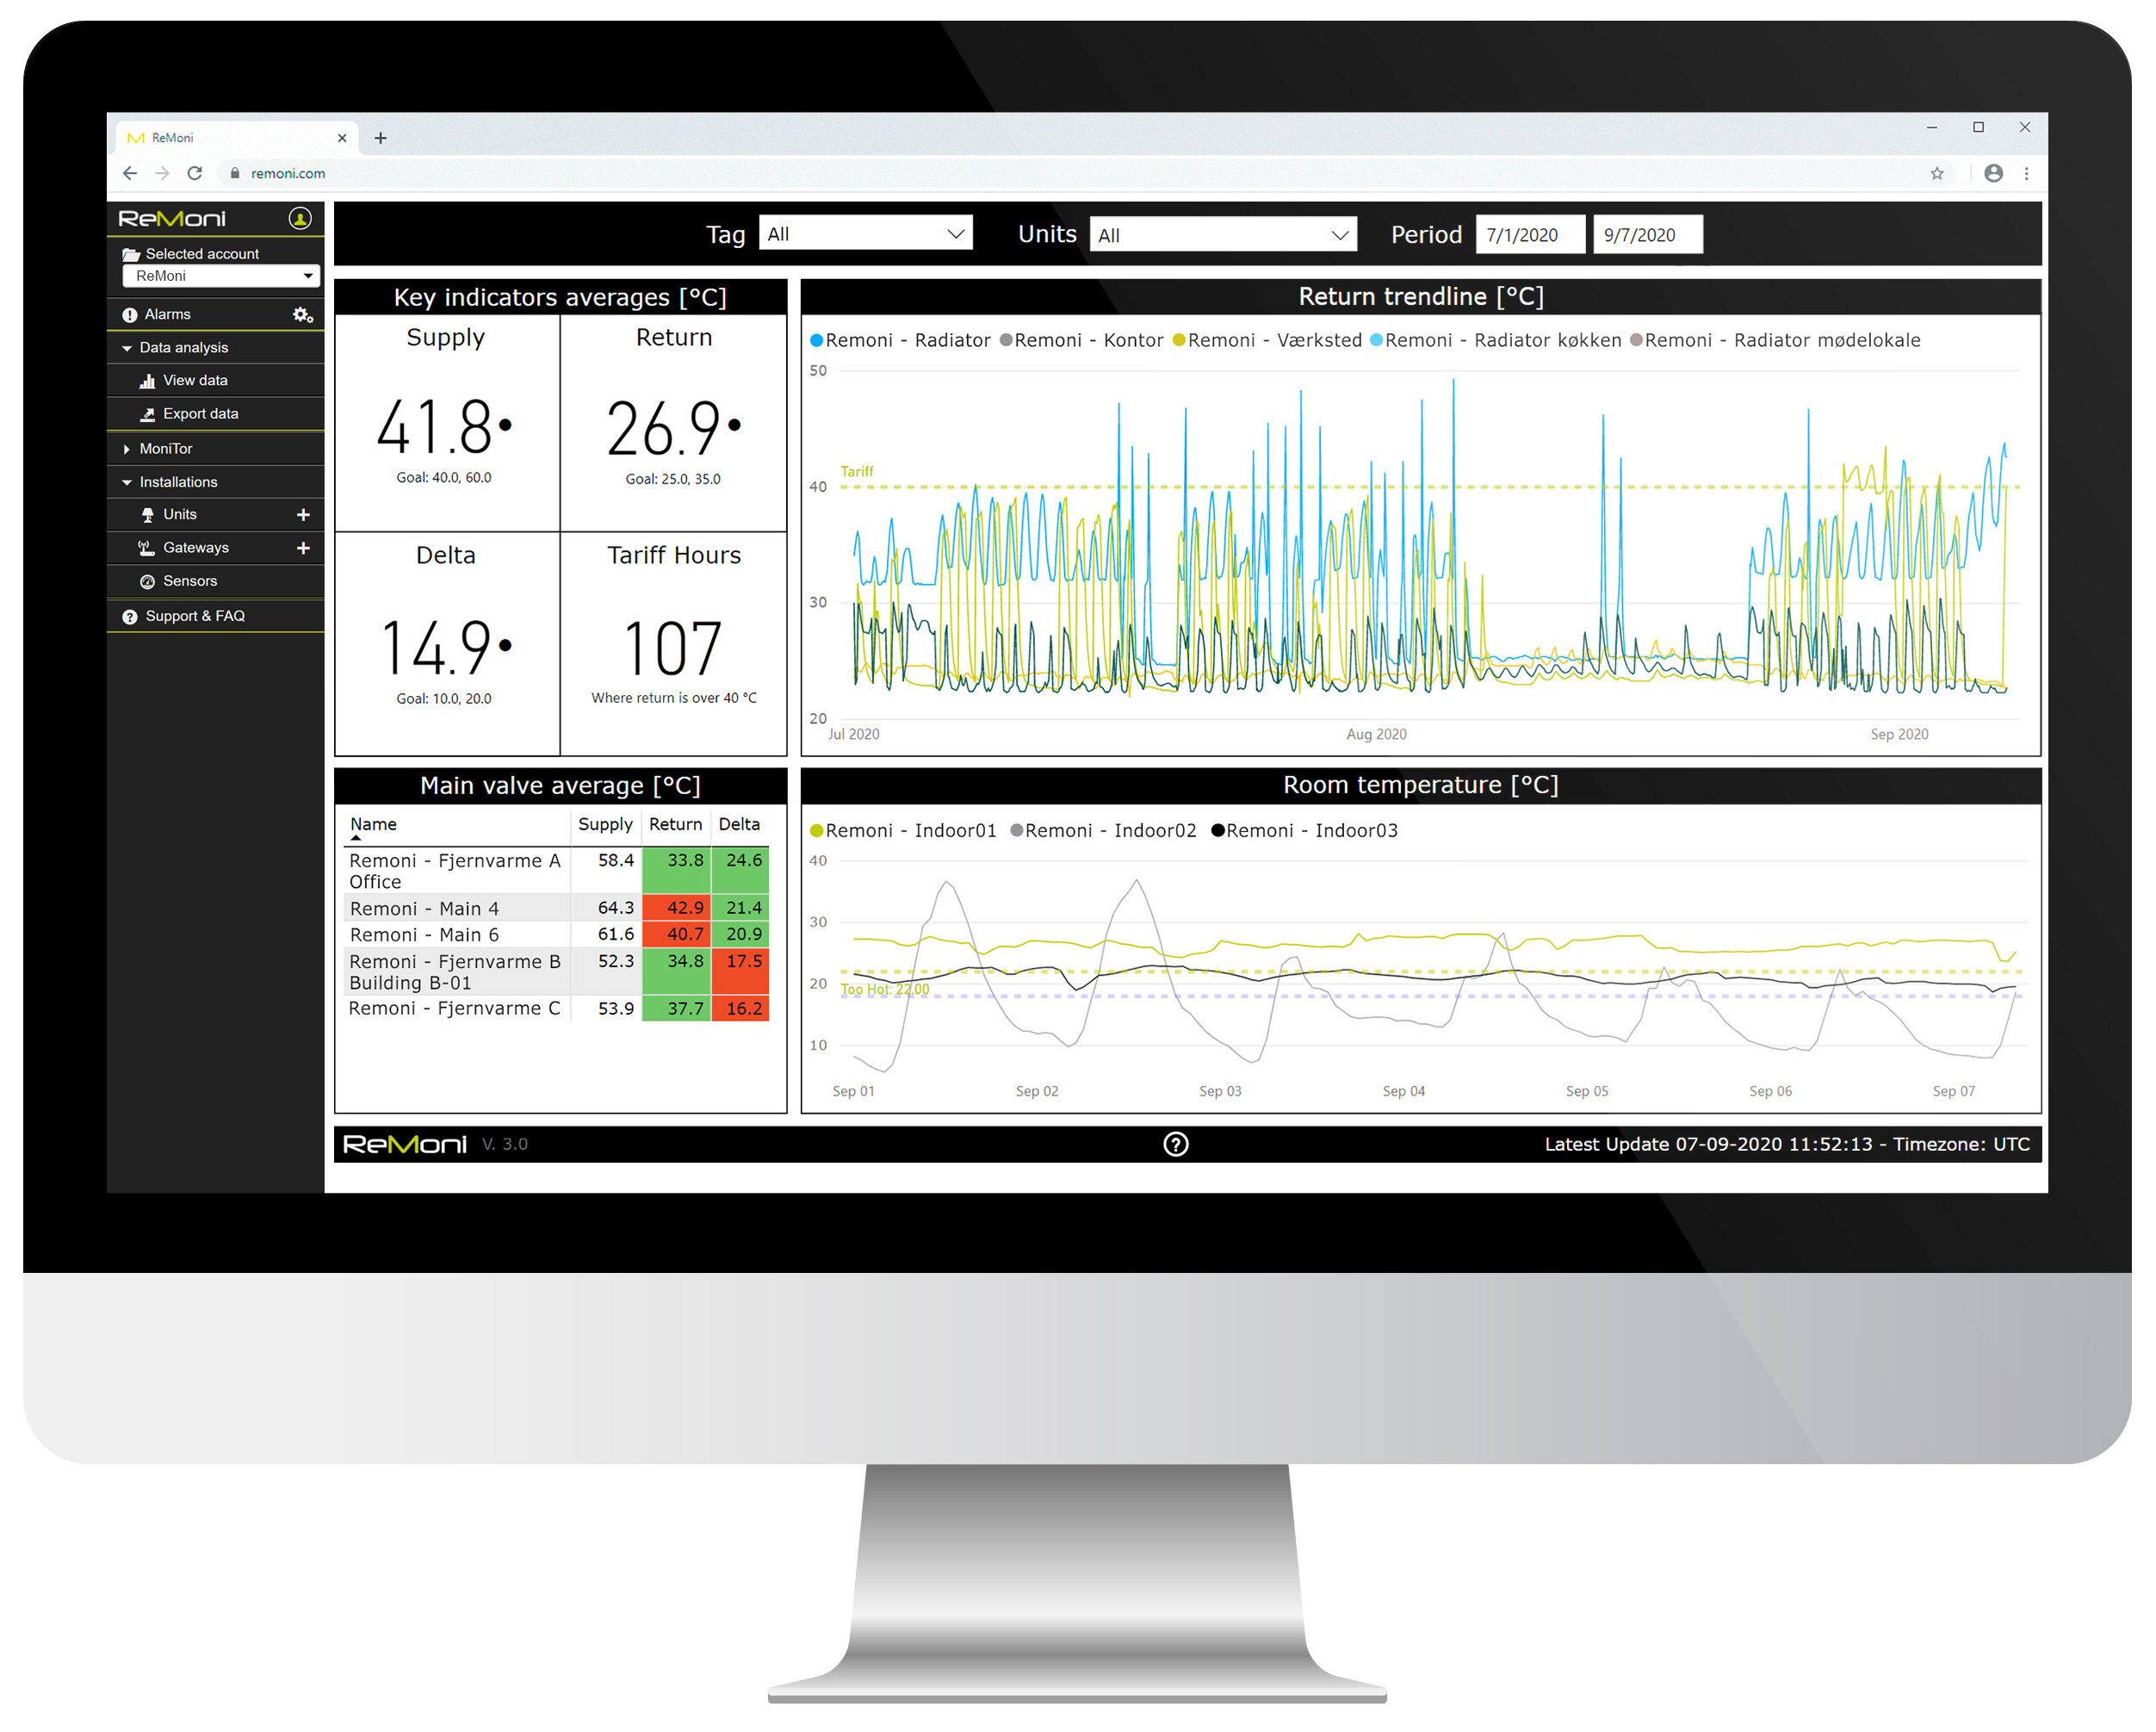
Figure: Data presentation in ReCalc Monitor showcasing the consumption for district heating with a HeatMoniSpot.
Customized to your needs
Sometimes a detailed overview is of great value. If your company also works better based on insights, you should consider the similar EMS-system ReCalc MoniTor, which provide you with an extended graphical overview.
Get an overview of the total and specific consumption: By looking into for example the power consumption you can easily analyze and compare the consumption shares used for lighting and ventilation – just to name a few.
You can compare ReCalc and ReCalc MoniTor on the pictures in this article and find more about ReCalc MoniTor’s extended data presentation here.